National Electricity Market Insights
Coal, Gas, and Employment
High coal and gas prices should bring forward investment in wind and solar and boost employment in Victoria.
30 Jun 2022
ITP Renewables has released its second National Electricity Market Insights report based on modelling using its open-source electricity grid modelling tool, openCEM (available at opencem.org.au). In this issue we analyse the effect of recent coal and gas price spikes on the renewable energy transition, and for the first time we assess impacts on employment in energy sector. This article summarises the findings presented in the full report.
Currently, Australia and the world are experiencing unprecedented high coal and gas prices, causing very high wholesale electricity prices in the electricity market, and the suspension of the conventional wholesale electricity market by the Australian Energy Market Operator (AEMO). To illustrate the effect of increased prices into the future, we collected predicted trajectories for coal and gas prices from World Bank forecasts and the Australian Competition and Consumer Commission (ACCC) Gas Inquiry and input scenarios with these increased prices and a range of net-zero targets into our openCEM model, keeping all other factors the same.
We use the Step Change scenario from the 2020 AEMO ISP as the base case for technology prices, uptake, and demand, as it is most similar to the Step Change scenario from the 2022 ISP, which we are currently implementing in our openCEM model and will be used for modelling in future reports.
The table below summarises the key points of difference for each scenario.

Scenario Comparison Table
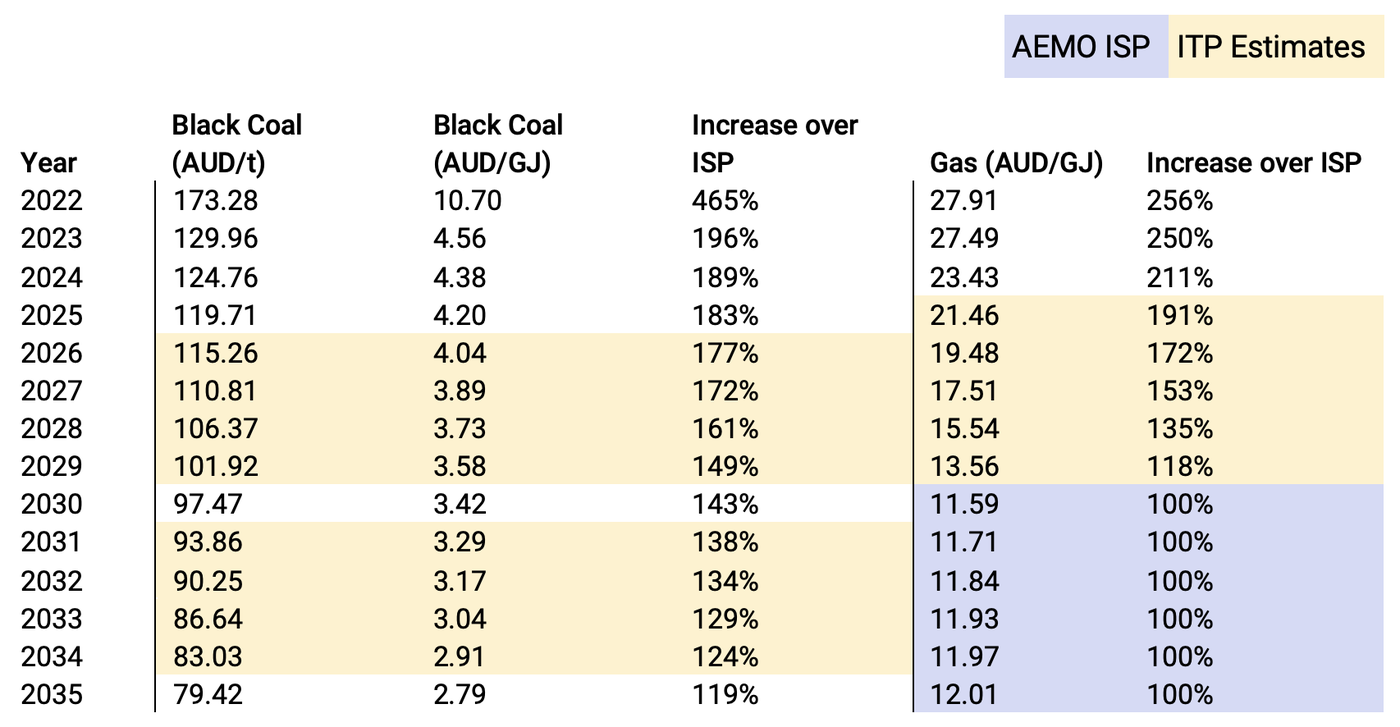
In the high coal and gas price scenarios, black coal prices were increased from 2022–2035 based on reports from the World Bank and the ACCC, returning to the prices from the ISP from 2036. AEMO ISP fuel prices were used beyond 2035. Brown coal prices were not changed from the AEMO ISP values for this modelling.
Coal and Gas Price Table
Results
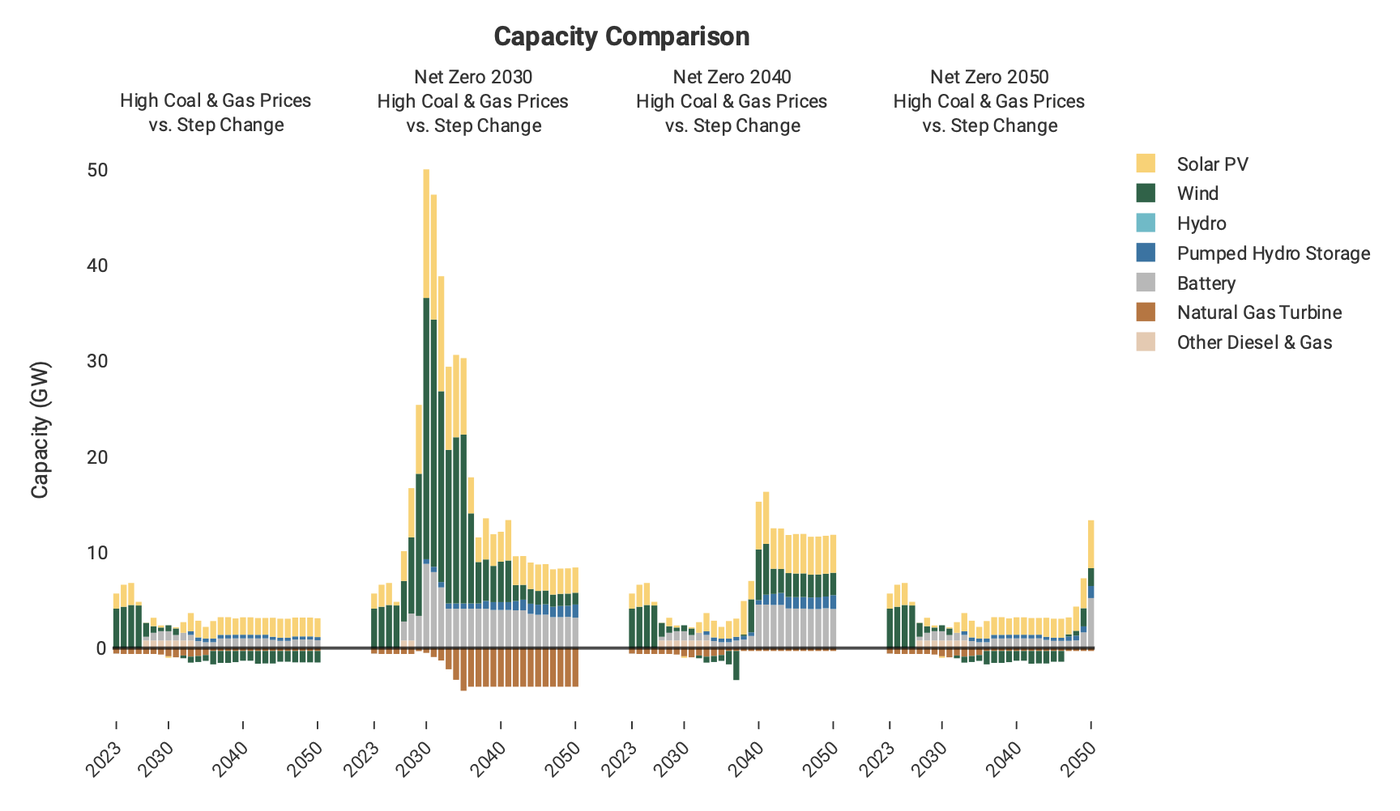
High coal and gas prices result in slightly less gas generation being built than in the base case, and approximately 7 GW of wind and solar are brought forward into the period from 2022 to 2025. By the 2040s, the high fuel prices result in slightly more solar, pumped hydro, and batteries in the NEM, and slightly less wind than the base case.
When a net zero 2030 target is added to high coal and gas prices, significantly less gas generation is built, and it is replaced by 50 GW of wind, solar, and battery builds being brought forward to the late 2020s and early 2030s. The result at the end of 2050 is more solar, wind, pumped hydro, and 4 GW more batteries than the base case, with 5 GW less natural gas.
In the capacity comparison graph below, bars above zero indicate that the comparison scenario has built more of that technology than the Step Change base case, and bars below zero indicate that it has built less.
High coal and gas prices reduce the amount of coal and gas generation that is dispatched in the years where the prices are higher, and an increase in dispatch of renewable wind, solar, and batteries. In the Net Zero 2030 and 2040 scenarios, less hydro is dispatched in the years after the net zero target. This has been replaced by an increase in the dispatch of solar, wind, battery, and pumped hydro.

Technologies such as hydrogen turbines and concentrating solar power with storage may join this mix to provide dispatchable power in the next decade, and we intend to investigate their role by implementing a broader range of possible technologies in openCEM for the upcoming quarterly report in September.
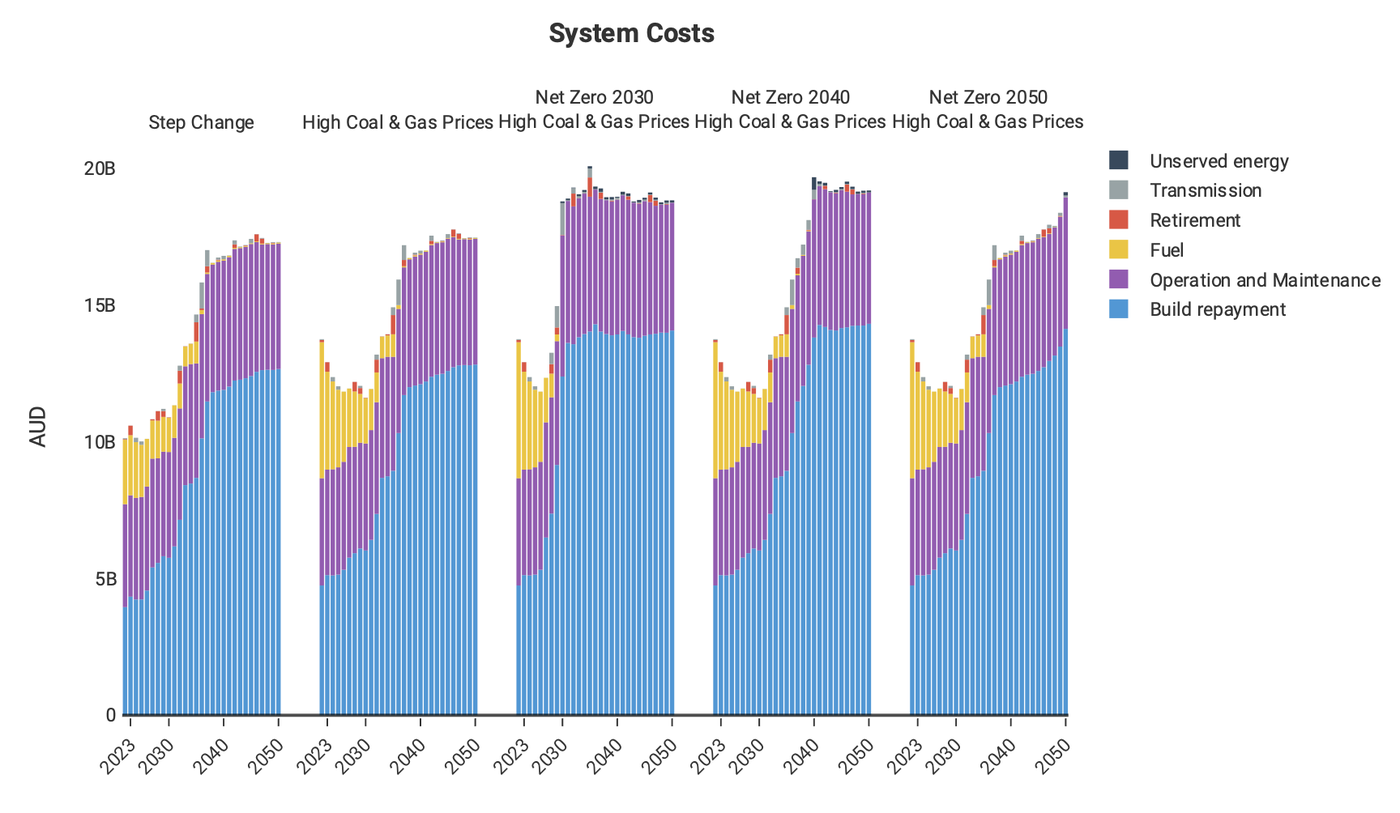
System costs in scenarios with increasing amounts of renewables are dominated by loan repayment, and operation and maintenance costs. Fuel costs increase dramatically in the early years for scenarios with high coal and gas prices, and reduce as the fuel prices decrease and more renewables are built to dispatch instead of fossil fuel generators.
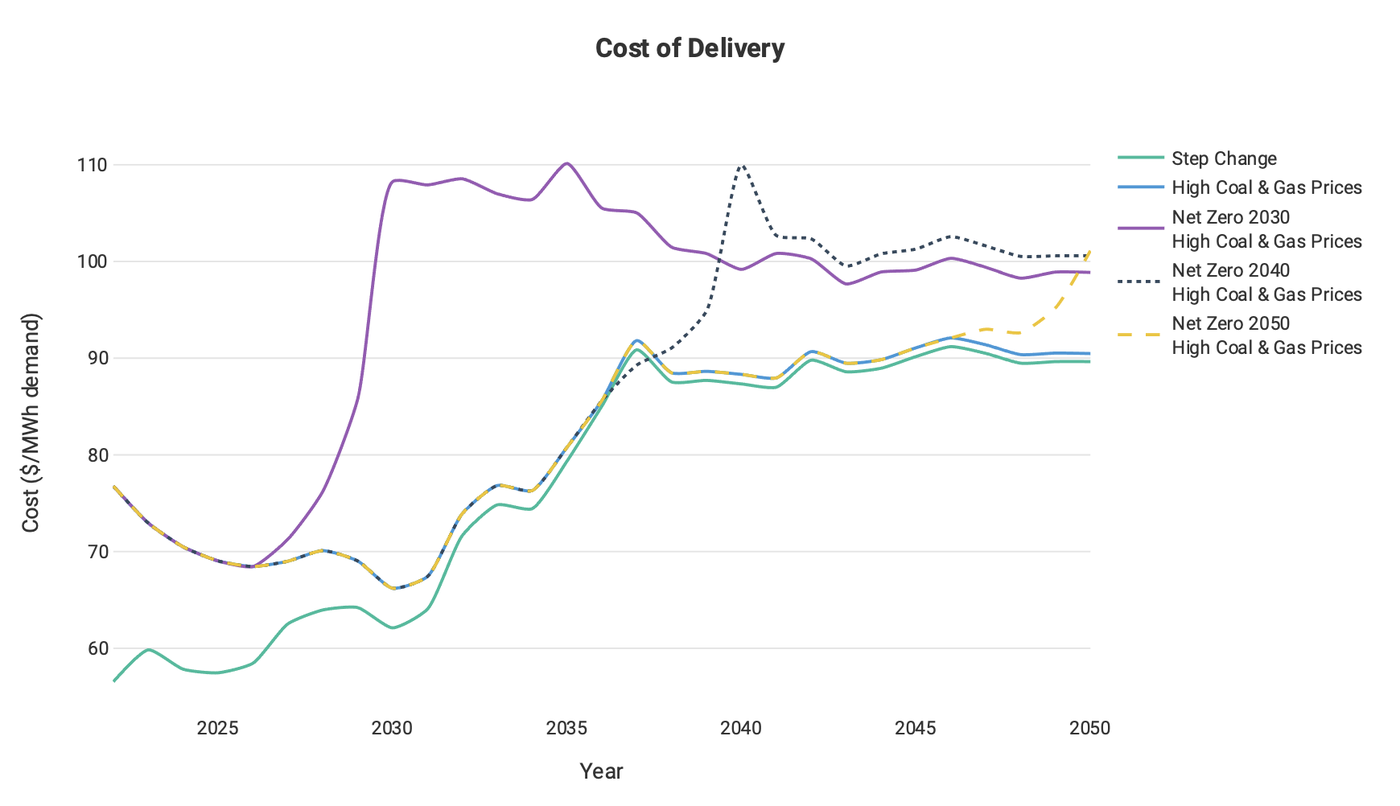
The graph above shows the cost of delivering each MWh of electricity in the NEM. It is calculated by dividing the total cost of the system by the total MWh of electricity delivered. It is worth noting that the cost of delivering electricity with high coal and gas prices, while higher than with lower fuel prices, is not nearly as high as wholesale prices have been in the first half of 2022. This could be one factor influencing the decision to suspend the market, as its current operation does not reflect the actual costs of producing electricity, and could artificially increase prices beyond what is required to maintain profits.
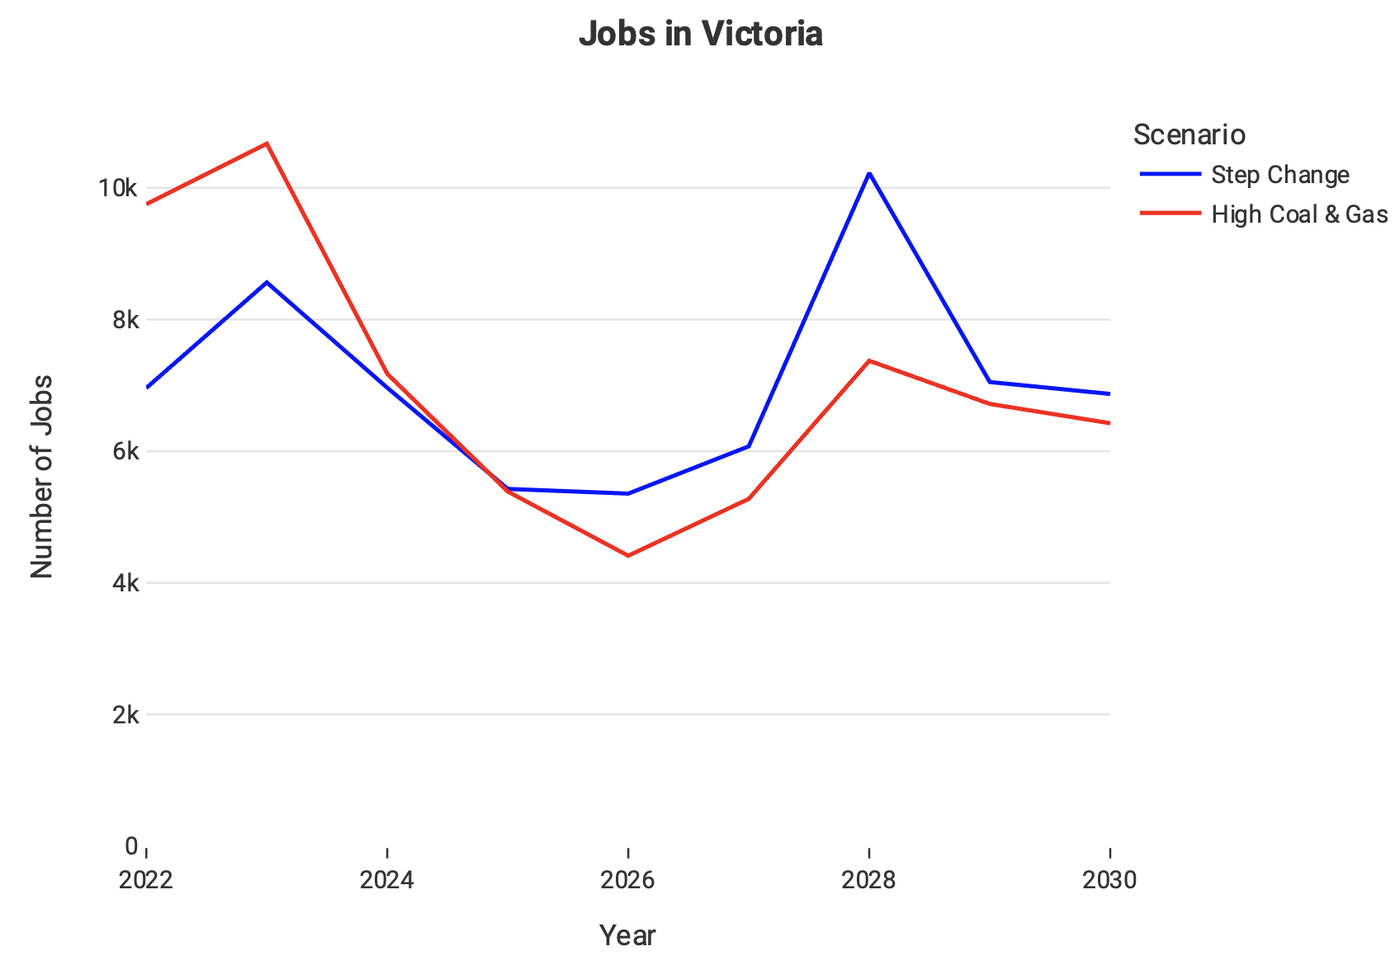
Employment Modelling
Our employment modelling predicts that the number of jobs in the NEM will increase in all scenarios. Much of this increase comes from the distributed solar and battery systems with high maintenance and construction employment factors. While considerably more utility scale solar capacity is installed, it can be more efficiently built and maintained, thereby producing fewer total jobs. The rest of the increase in job numbers is largely caused by new wind installations which have higher operation and maintenance factors than the non-renewable technologies they are replacing.
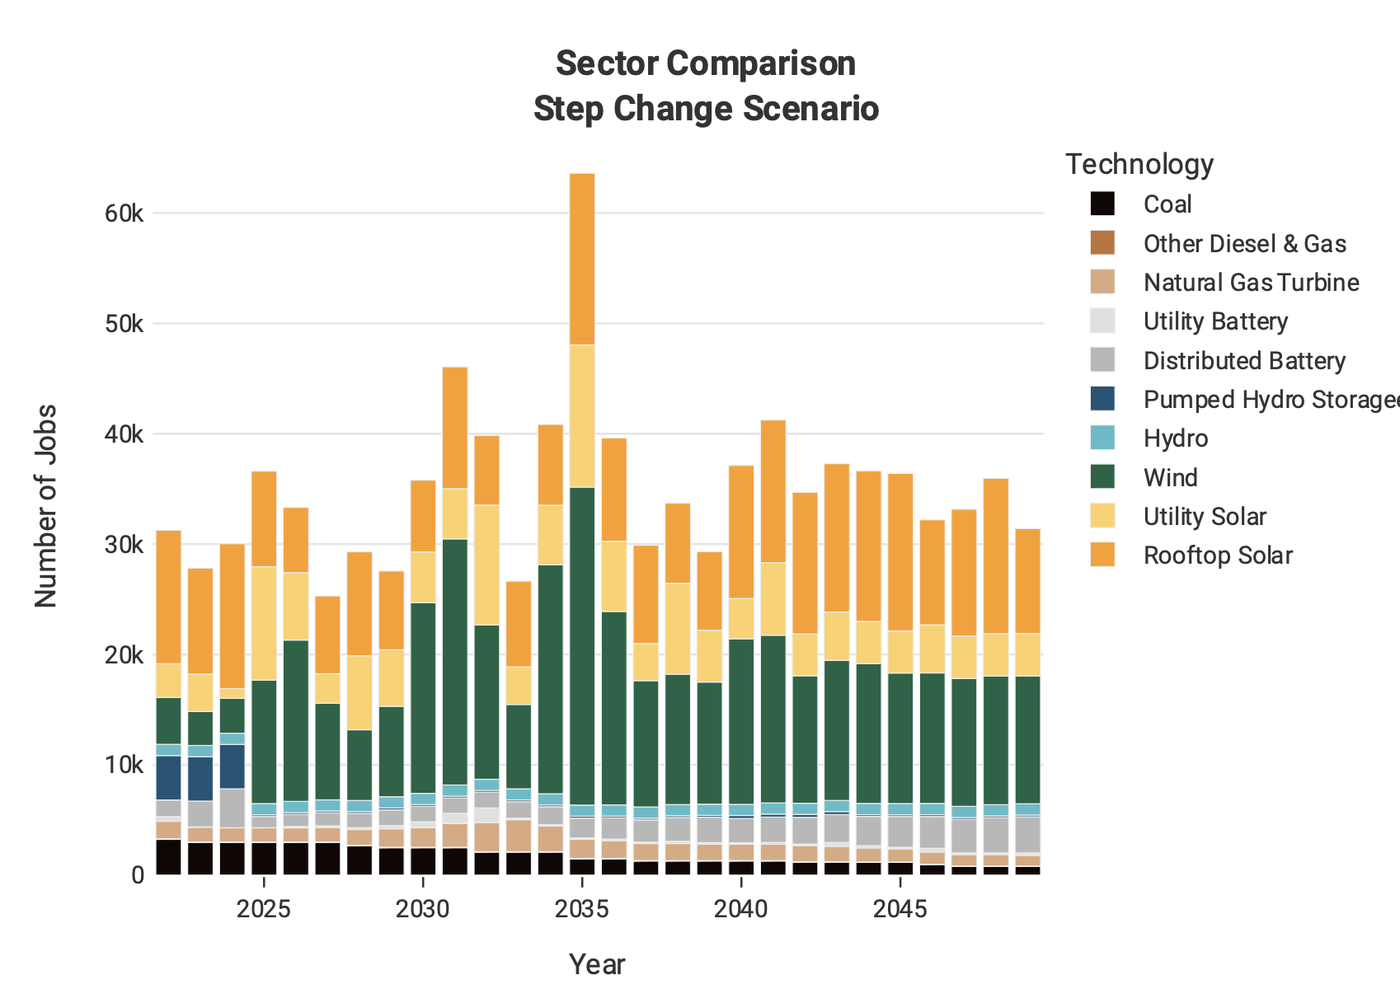
Higher coal and gas prices boost the number of jobs in Victoria from 2022–25 due to a predicted 7GW of solar and wind energy construction being brought forward to those years.